Moz Q&A is closed.
After more than 13 years, and tens of thousands of questions, Moz Q&A closed on 12th December 2024. Whilst we’re not completely removing the content - many posts will still be possible to view - we have locked both new posts and new replies. More details here.
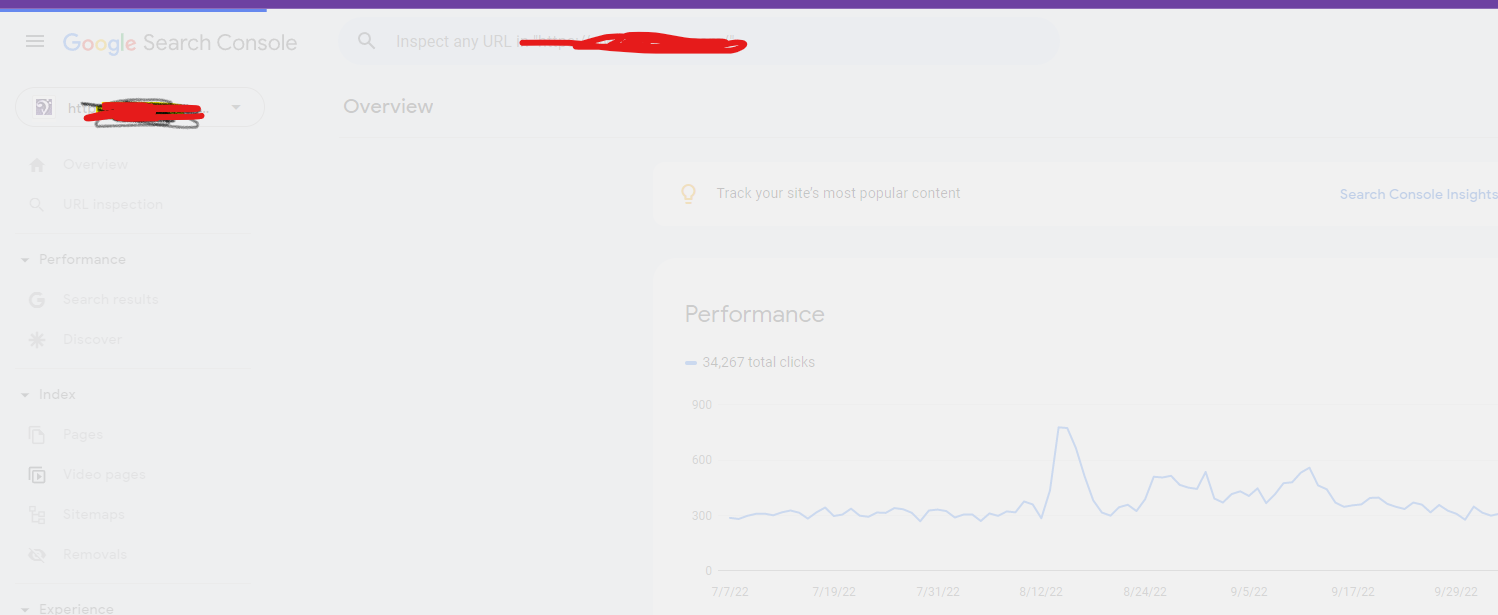
Google Search Console not loading some resources
-
When I check an URL with Search Console it cannot load some page resources, even from other domains (like: ssl.google-analytics.com, www.facebook.com and www.google-analytics.com).
Have any of you experienced this issue?
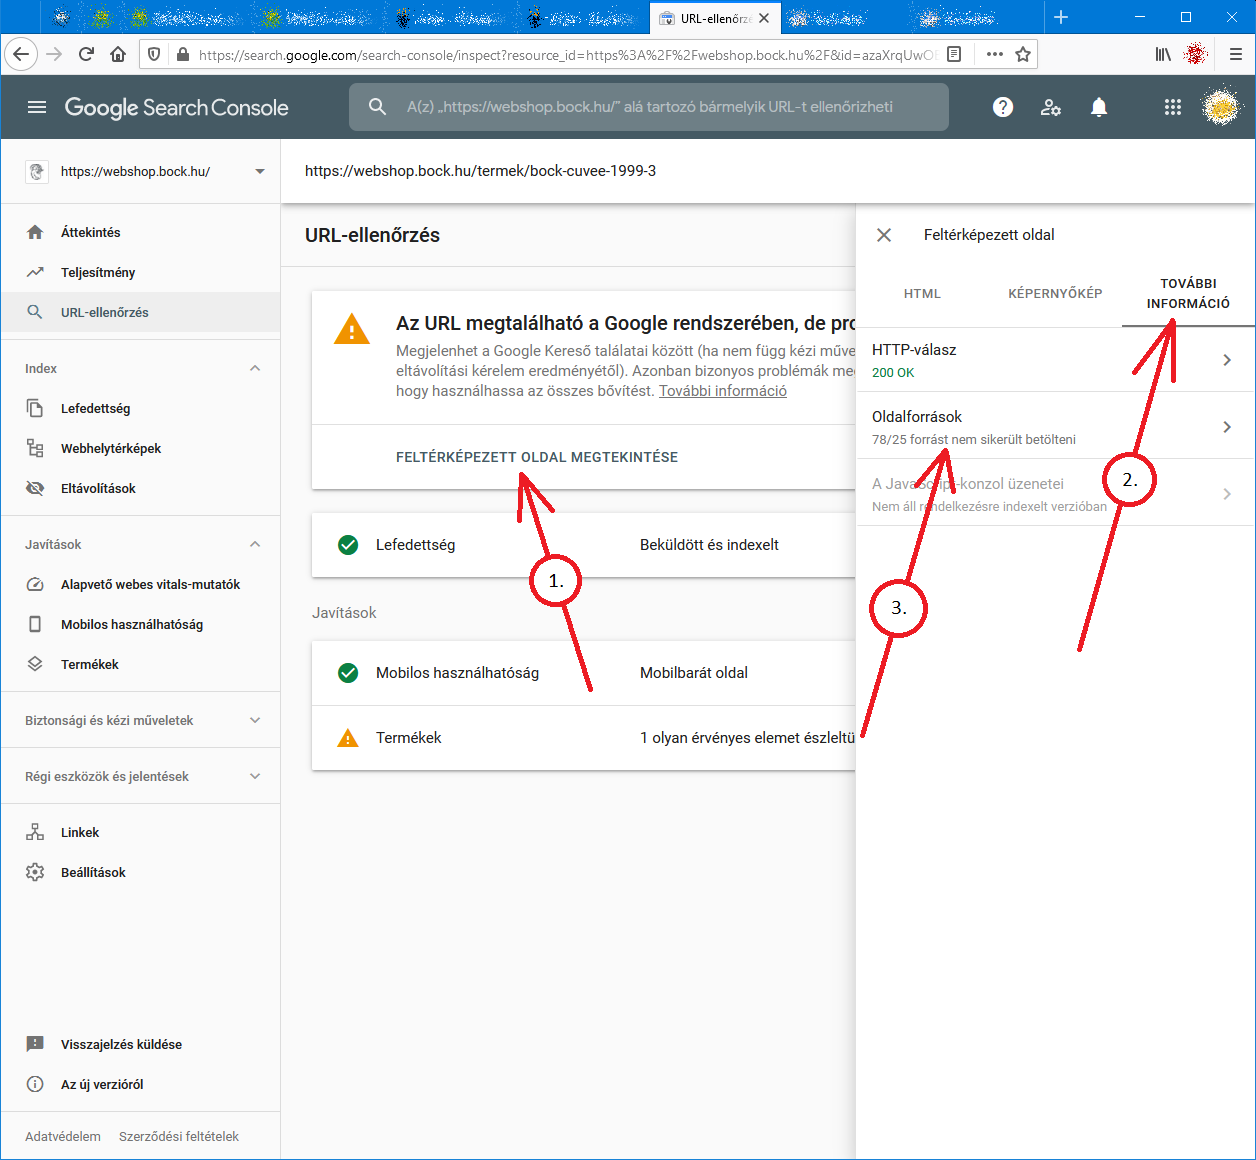
Steps to reproduce:- open Google Search Console
- check an URL
- click "View crawled page" link
- select "More info" tab
- click "Page resources" {?}/{?} couldn't be loaded
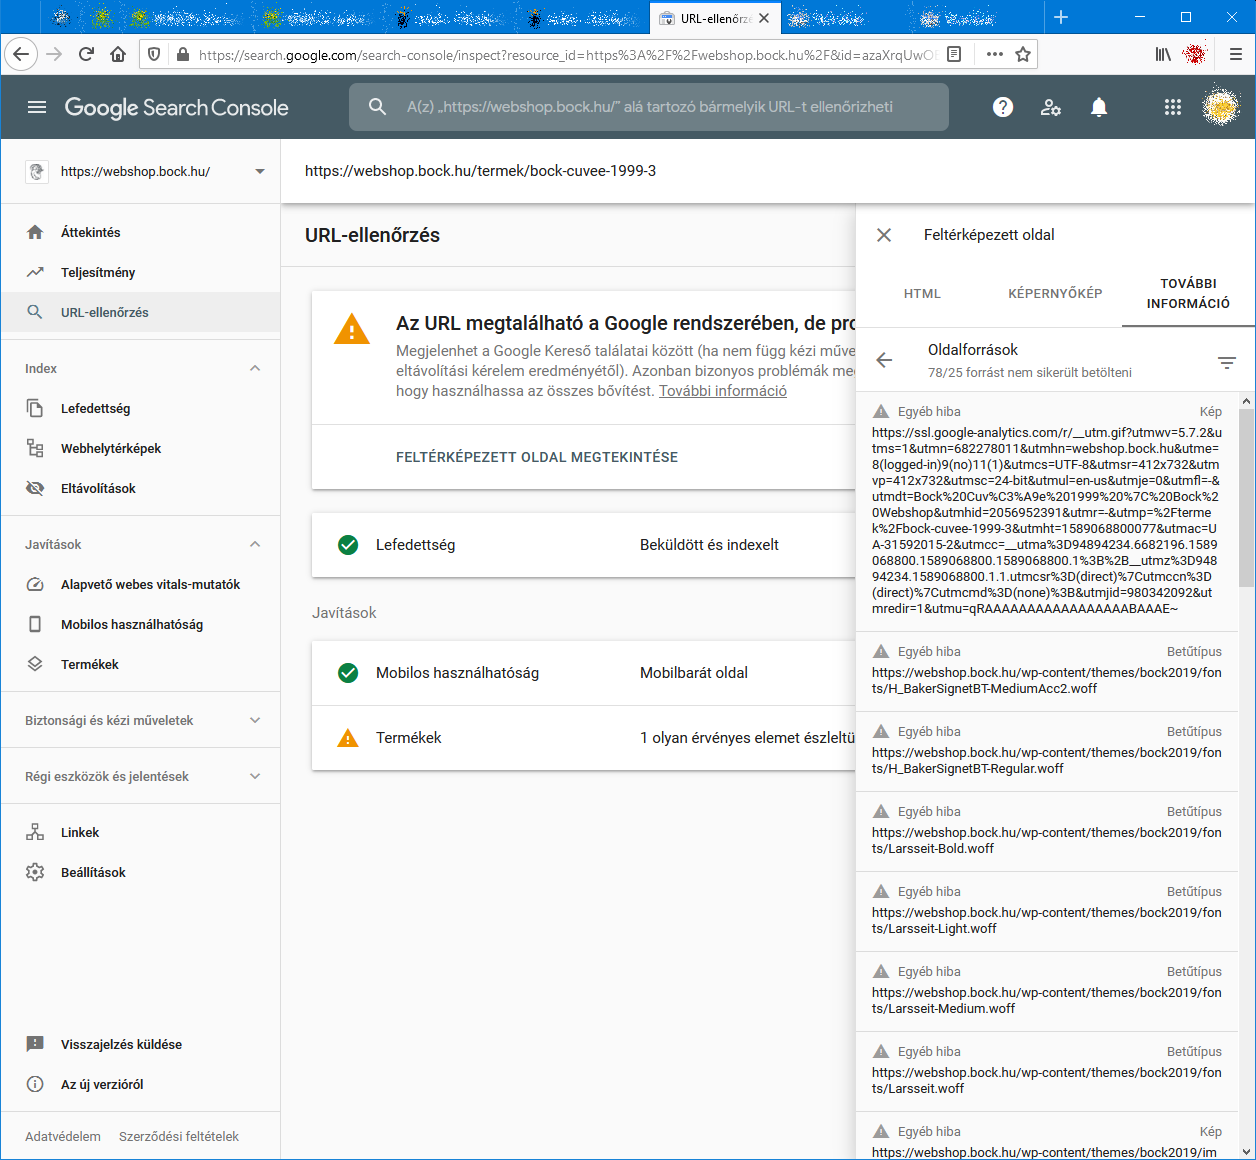
When I check the listed resources, all of them can be loaded from a web browser.
So I do not understand why Google cannot load them.
And there is no additional info why the resources could not be loaded.
Any ideas?google-search-console-other-error-1.png google-search-console-other-error-2.png
-
I am facing issue for my https://jobdekho247.com site, web stories are not loading in search console, Refused to load the stylesheet. How can i fix it?
Currently I am using premium version of GeneratePress theme.
-
Google Search Console Pages Not Loading properly since a week
Google search console for my two websites is taking too much time to load. Although I have very good internet connection. When I reload the same page 2nd time then it loads quickly. What is this issue and how to resolve this?
- Can someone help?
-
I also facing this issue, for my https://www.uaeadvise.com/ site, Google Search Index Tool isn't showing for my website. Does anyone know how to fix it? - Thanks in Advance!!
-
I am also facing the issue, for my https://www.darsaal.com/ site, Google Search Index Tool isn't showing for my website. Does anyone know how to fix it?
-
The internal resources are not disallowed.
The other resources are very important. Google Analytics has to work.
The original question is still unanswered. -
While I can't read the language in your screenshots, I can recommend that if those resources are on your own domain, make sure they are not disallowed by the robots.txt file. If they are on external domains, ones which you don't control, then there's really not anything for you to do, and you may as well ignore.
Got a burning SEO question?
Subscribe to Moz Pro to gain full access to Q&A, answer questions, and ask your own.
Browse Questions
Explore more categories
-
Moz Tools
Chat with the community about the Moz tools.
-
SEO Tactics
Discuss the SEO process with fellow marketers
-
Community
Discuss industry events, jobs, and news!
-
Digital Marketing
Chat about tactics outside of SEO
-
Research & Trends
Dive into research and trends in the search industry.
-
Support
Connect on product support and feature requests.
Related Questions
-

Impression and click discrepancies in Search Console when filtering by date
I recently filtered query information by week and day. The impression and click totals were different depending on whether I looked at totals by a full weeks or by day. So for example, the impression and click totals when I choose a date range of monday-sunday are different when I look at impressions and clicks that same week by day and then add up the click and impression numbers to get a weekly total. At first i was expecting a slight difference since I know the data is heavily sampled but the totals were very different. Any explanations for this? Thanks
Reporting & Analytics | | znotes0 -

Conflicting average position data from Google Search Console?
I'm looking at Google Search Console data in Google Analytics, specifically Average Position as given in the Landing Page report, and the same metric broken out by mobile and desktop in the Devices report. In the Landing Page report, I see an aggregated average position that's much higher/worse than an actual average of what is reported for mobile, desktop and tablet traffic under the Device reporting. For example: Mobile: 5 Desktop: 5 Tablet: 5 So the average still should be roughly 5, right? Why would the Landing Page then show an aggregate Average Position of 8? I wouldn't expect to see a precisely same average given that different device types have different proportions that could render differently when the buckets are combined, but this is a huge swing. In fact, the aggregate Average Position as given in the top level Devices report is closer to 5 than to the 8 shown in the Landing Pages report. (These aren't actual numbers, but are illustrative of what I'm seeing, by the way.) Unless I'm missing some vital difference in the way that Average Position is reporting for the Landing Page report versus the Device reports, it doesn't seem like this should be possible. What am I missing?
Reporting & Analytics | | BradsDeals0 -

In Google Search Console: Total Clicks differ from the sum clicks on search queries
Hi.This may be a google technical question, but I've searched a lot and I couldn't find any certain information about that.The problem appears when you look at two stats in Search Console ( WebMasters Tools, some months ago), particulary in the Search Analysis.1- Total clicks2- Sum of clicks at every search query.I attached an image to make me clear.8IZsxs6.png
Reporting & Analytics | | NachoRetta2 -

Google Search Console - Why is my average mobile position better than my average desktop position?
I'm wondering why my average mobile position is much better than my average desktop position. I'm wondering if Google is comparing the same queries for both mobile vs desktop or if they're only showing me the top ranked for each type of search. Is it example 1 or 2? Example 1: Desktop may have 5,000 ranking queries that average to 21.6
Reporting & Analytics | | Pauly_Gigs
Mobile may have 1,500 ranking queries that average to 8.5 OR Example 2: example.com has 5,000 total ranking keywords, those queries' average ranking in a desktop search 21.6 and mobile search 8.5. I'm curious to know exactly what I'm seeing in Google's Search Console. https://08875344305734164866.googlegroups.com/attach/777ae98664ed418f/Mobile%20VS%20Desktop.png?part=0.1&view=1&vt=ANaJVrEHOjRLlPH43i00NnC8PxaG3ct7bsHum_TWnUoa7xVamCpRp8jrvRQJL-gz4n7Q0otqKcKxcAJA5z1VySs2naQU_Zy5tDps6bJhUSZsLRQq4uU-tJQ0 -

Google Analytics Organic Search Keywords Suddenly Displaying FulL Urls
In my Google Analytics, the top keywords for Organic Search are suddenyl displaying full URLs. For example, now the third and fourth keywords are http://www.domain.com/highly-specific-URL. These have all started recently around the same day, July 12th. I've checked back, and we've made no internal changes to the site around that time that could affect this. Any thoughts on this? Thanks! P.S. It might be related to rich snippets, but I cannot tell at this point.
Reporting & Analytics | | 10SL0 -

Google as referring domain
Hi all, a colleague asked a question, which I could not answer (never even noticed this "problem") 😞 When we are logged into our GA account and go the referring domains section, we find Google. I always thought that these visitors came via Google Image Search, but not all of them do. Most of them come via "/imgres", but some come via "/" (always thought that "/" was the homepage?), "/url" and "//" Maybe I am just stupid, but honestly I could not explain what these strings mean... or how these visitors landed on our site... Can you help me???
Reporting & Analytics | | accessKellyOCG0 -

Google Analytics Showing Inflated Product Revenue
Hi- For the month of Feb on two of our sites we are seeing inflated product revenues. I have not seen this before and I am not having any luck searching for answers. Here is the issue: Product B sells for $159.95 For the month of Feb we sold 3 thus revenue should be ~$479.85 GA is showing Product B's revenue at $3,360.00 I read online that sometimes folks will bookmark the receipt page and that can cause this and we would need to put a catch in place for this but I am guessing this is not the case as it is happening on two sites. Please let me know if you have any questions.
Reporting & Analytics | | K2_Sports0 -

Comparing % Change, Google Analytics
Hey Mozzers, Is there a simple way to compare the "% Change" in traffic when comparing two separate time periods in a single Google Analytics report? When comparing data from two separate time periods, an exported CSV doesn't include the % Change (booo!), and there's no option to sort by % Change within the GA report, essentially forcing you to scroll through all the results to pinpoint the major movers and shakers. I'm not averse to using spreadsheets to sort this data, but I'm thinking that I'd likely need a macro to make this work, something like this. However, none of the macros on that page are working (possibly because they were designed for a previous version of Analytics). All suggestions are appreciated. Thanks!
Reporting & Analytics | | dangaul0